

18 Apr What Are Primary Drivers of E&O Claims?
We were given some interesting claims data with special thanks to Swiss Re. Please note that this claims information is from agencies Swiss Re insures outside the E&O Plus program. The data is especially relevant as it is current (2018-2022) and thus indicates the latest trends in E&O claims.
There has not been much claim activity involving Swiss Re (that’s good news!) due to the length of time they have been the E&O Plus program carrier.
A few comments on each of these pie charts:
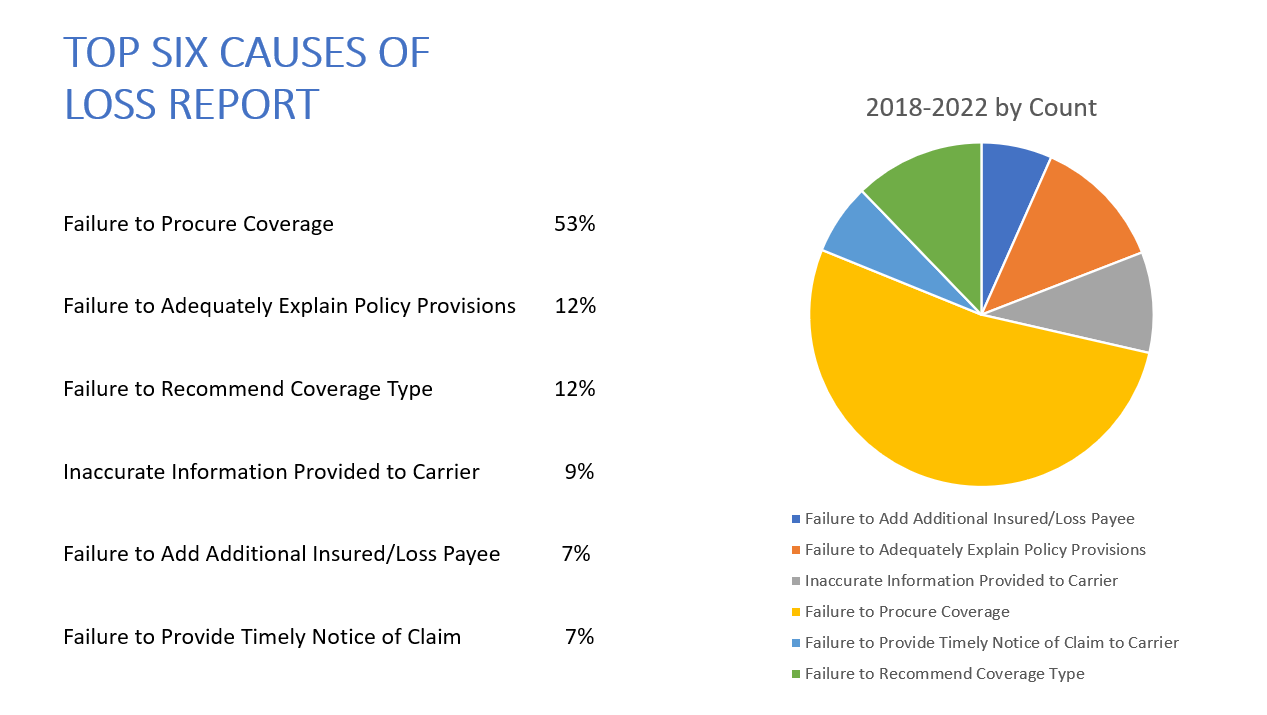
As you probably have been advised over the years, the #1 cause of E&O claims involves “Failure to Procure Coverage.” In most of these claims, the scenario probably involves the insured experiencing an uninsured claim. When this happens, especially in the loss is significant, the insured may look to bring an action against the agency, alleging the agency is responsible for the insured not having the proper coverage. This gets to the heart of key E&O issues, especially the Exposure Analysis checklist for new and renewal and the need to document back to the insured the purchase decisions they are making. One of the causes that I particularly find concerning is “Inaccurate Information provided to Carrier.” The carriers are counting on the applications being accurate. When they are not, they may be able to allege Material Misrepresentation and thus not be responsible for paying the underlying loss leaving the agency to now assume that responsibility. The last item continues to be a key issue, “Failure to Provide Timely Notice of Claim,” as in the E&O Plus program (since 1986), this has been a major driver of E&O claims.
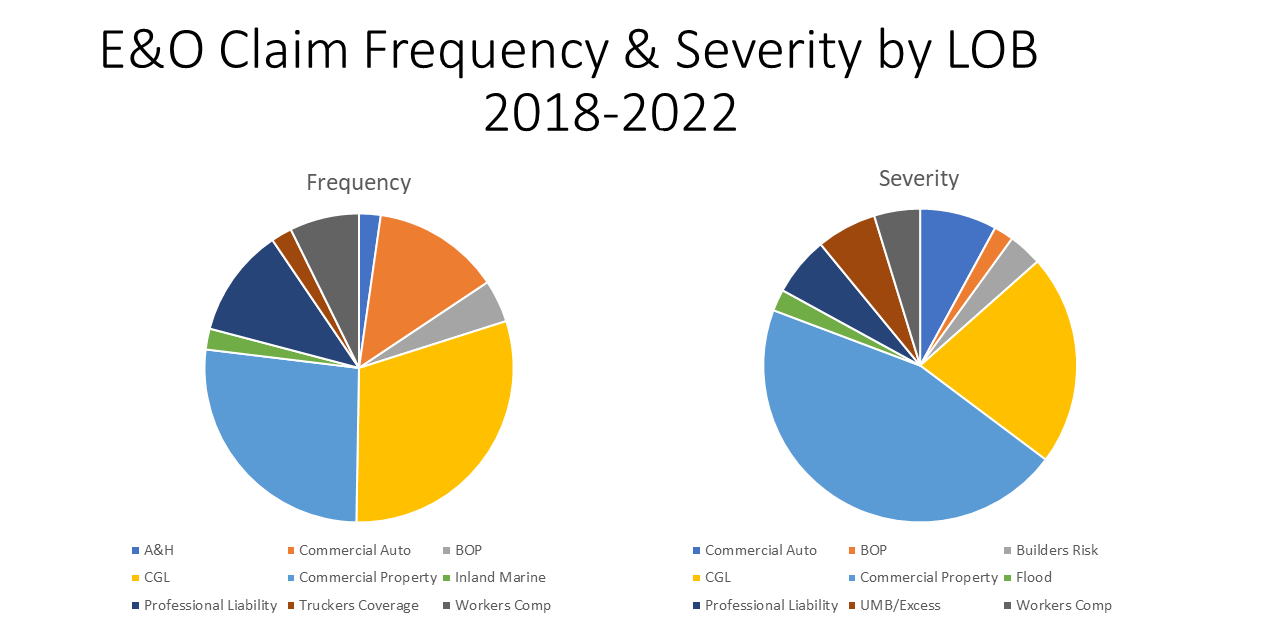
These two pie charts show the lines of business generating the E&O claims based on frequency (the number of claims) and severity (the size of the claims). In frequency, GL and Property make up around 65%. However, E&O claims can arise from the procurement (or lack thereof) for virtually every type of coverage. Property is clearly the one line of business generating the biggest awards in the severity chart. I would guess that valuation is one of the top issues.
The Personal Lines and Benefits folks in your agency probably see their respective areas generating little in frequency or severity. This also holds true for the E&O Plus program over the last five years. It is important, however, not to think these two areas don’t generate any E&O claims. They do, but Commercial Lines does seem to dominate the E&O claims picture. Regardless of the line of business, E&O loss prevention Best Practices are key to every agency division.